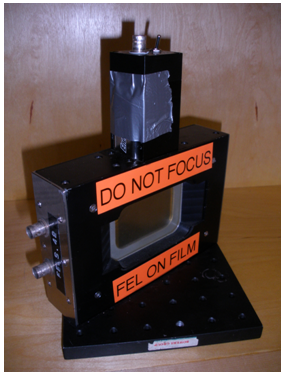
Fig. 1: The Thomas Keating power meter
- Continuous-wave operation; a modulated (chopped) signal is measured. The Thomas Keating is a power detector. The responsivity is modulation frequency-dependent. Data provided here are for 20 Hz modulation frequency, a duty cycle of 50%, and square wave modulation (“on/off”).
- Measurement of pulses; when measuring pulses that are much shorter than the time constant of the detector, the detector shows an impulsive response, proportional to the pulse energy. The pulse duration should therefore not exceed 1 ms. The repetition rate of the pulses must be smaller than the inverse time constant of the detector. According to the manual, repetition rates below 40 Hz are fine, however, this is a “soft” boundary. In general, the responsivity will also depend on the repetition rate of the laser. Data given here are for a repetition rate of 1 Hz (the repetition rate of the UCSB FEL) .
DC Characterization
April 15th 2011: DC resistance of the film was measured to be 173.91 Ω ± 0.02 Ω for biases between 0.3 and 7 V.Continuous-Wave Characterization
We used a frequency generator to provide a square wave bias with 20 Hz modulation and 50% duty cycle. The amplitude was varied between 0.307 and 0.605 V resulting in input powers between 0.542 mW and 2.1 mW. Due to the fairly long time constant of the detector, the output signal is a distorted square wave as illustrated in Fig 2.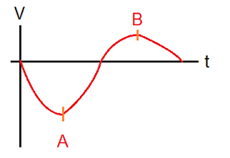
Fig. 2: Schematic response of the Thomas Keating power meter to 20 Hz square wave signals.
- We extracted the peak to peak values using an oscilloscope
- We used a lock-in to read the rms value
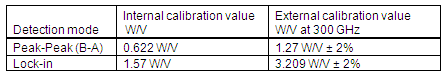
Table 1: Calibration values for continuous-wave operation (20 Hz modulation). Errors are estimated.
Pulsed Characterization
The signal of the frequency generator was modified to provide short pulses with a repetition rate of 0.99 Hz. We used pulse durations between 0.125 ms and 1 ms and bias voltages on the film between 2.31 and 6.96 V leading to pulse energies between 30.68 µJ and 278.5 µJ. The impulsive response of the detector is schematically illustrated in Fig. 3. Note that the shape and duration of this signal does not depend on the pulse duration. It is limited by the speed of the detector itself.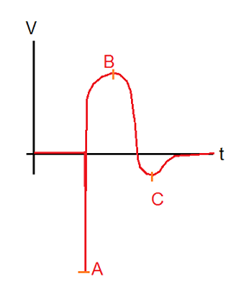
Fig. 3: Response of the Thomas Keating detector to short pulses
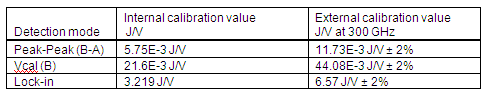
Table 2: Calibration factors for pulsed operation (0.99 Hz repetition rate). Errors are estimated.
Compared to a measurement performed in 2007, the (internal) peak-peak calibration values differ only by 0.03 %, the Vcal values (B) differ by about 4 %. The pulse energies in that experiment were between 64.8 µJ and 0.58 mJ, the pulse durations were in the µs range (with heating biases around 100 V).
Written by Sascha Preu
Measurements performed by Sascha Preu, Luis-Claude Brunel and Susumu Takahashi